How accurate is AI LiDAR classification? Measuring and validating results
Ask how accurate AI LiDAR classification is, and the honest first answer is another question: on which class, at what point density, over what terrain? A single percentage flattens all of that into one number, and a number without its context cannot be checked, compared, or reproduced. Here is how to measure classification accuracy so the figure actually means something.
Why one percentage says almost nothing
Overall accuracy is the share of points that got the right class. It is easy to compute, easy to quote, and easy to be fooled by. Ground and high vegetation hold most of the points in a typical airborne block. A model can label those well, miss nearly every pole and patch of low vegetation, and still post an impressive number, because the hard classes hold too few points to move the average. The same model also scores differently depending on which classes are counted, how dense the cloud is, and what the terrain looks like. Only a per-class breakdown shows where the errors actually live.
The metrics, defined properly
Every real accuracy measure starts from the confusion matrix. Rows are the reference class, what a point truly is. Columns are the class the model assigned. The diagonal is agreement, and everything off it is an error whose position tells you the direction of the mistake. Here is a worked example for one tile:
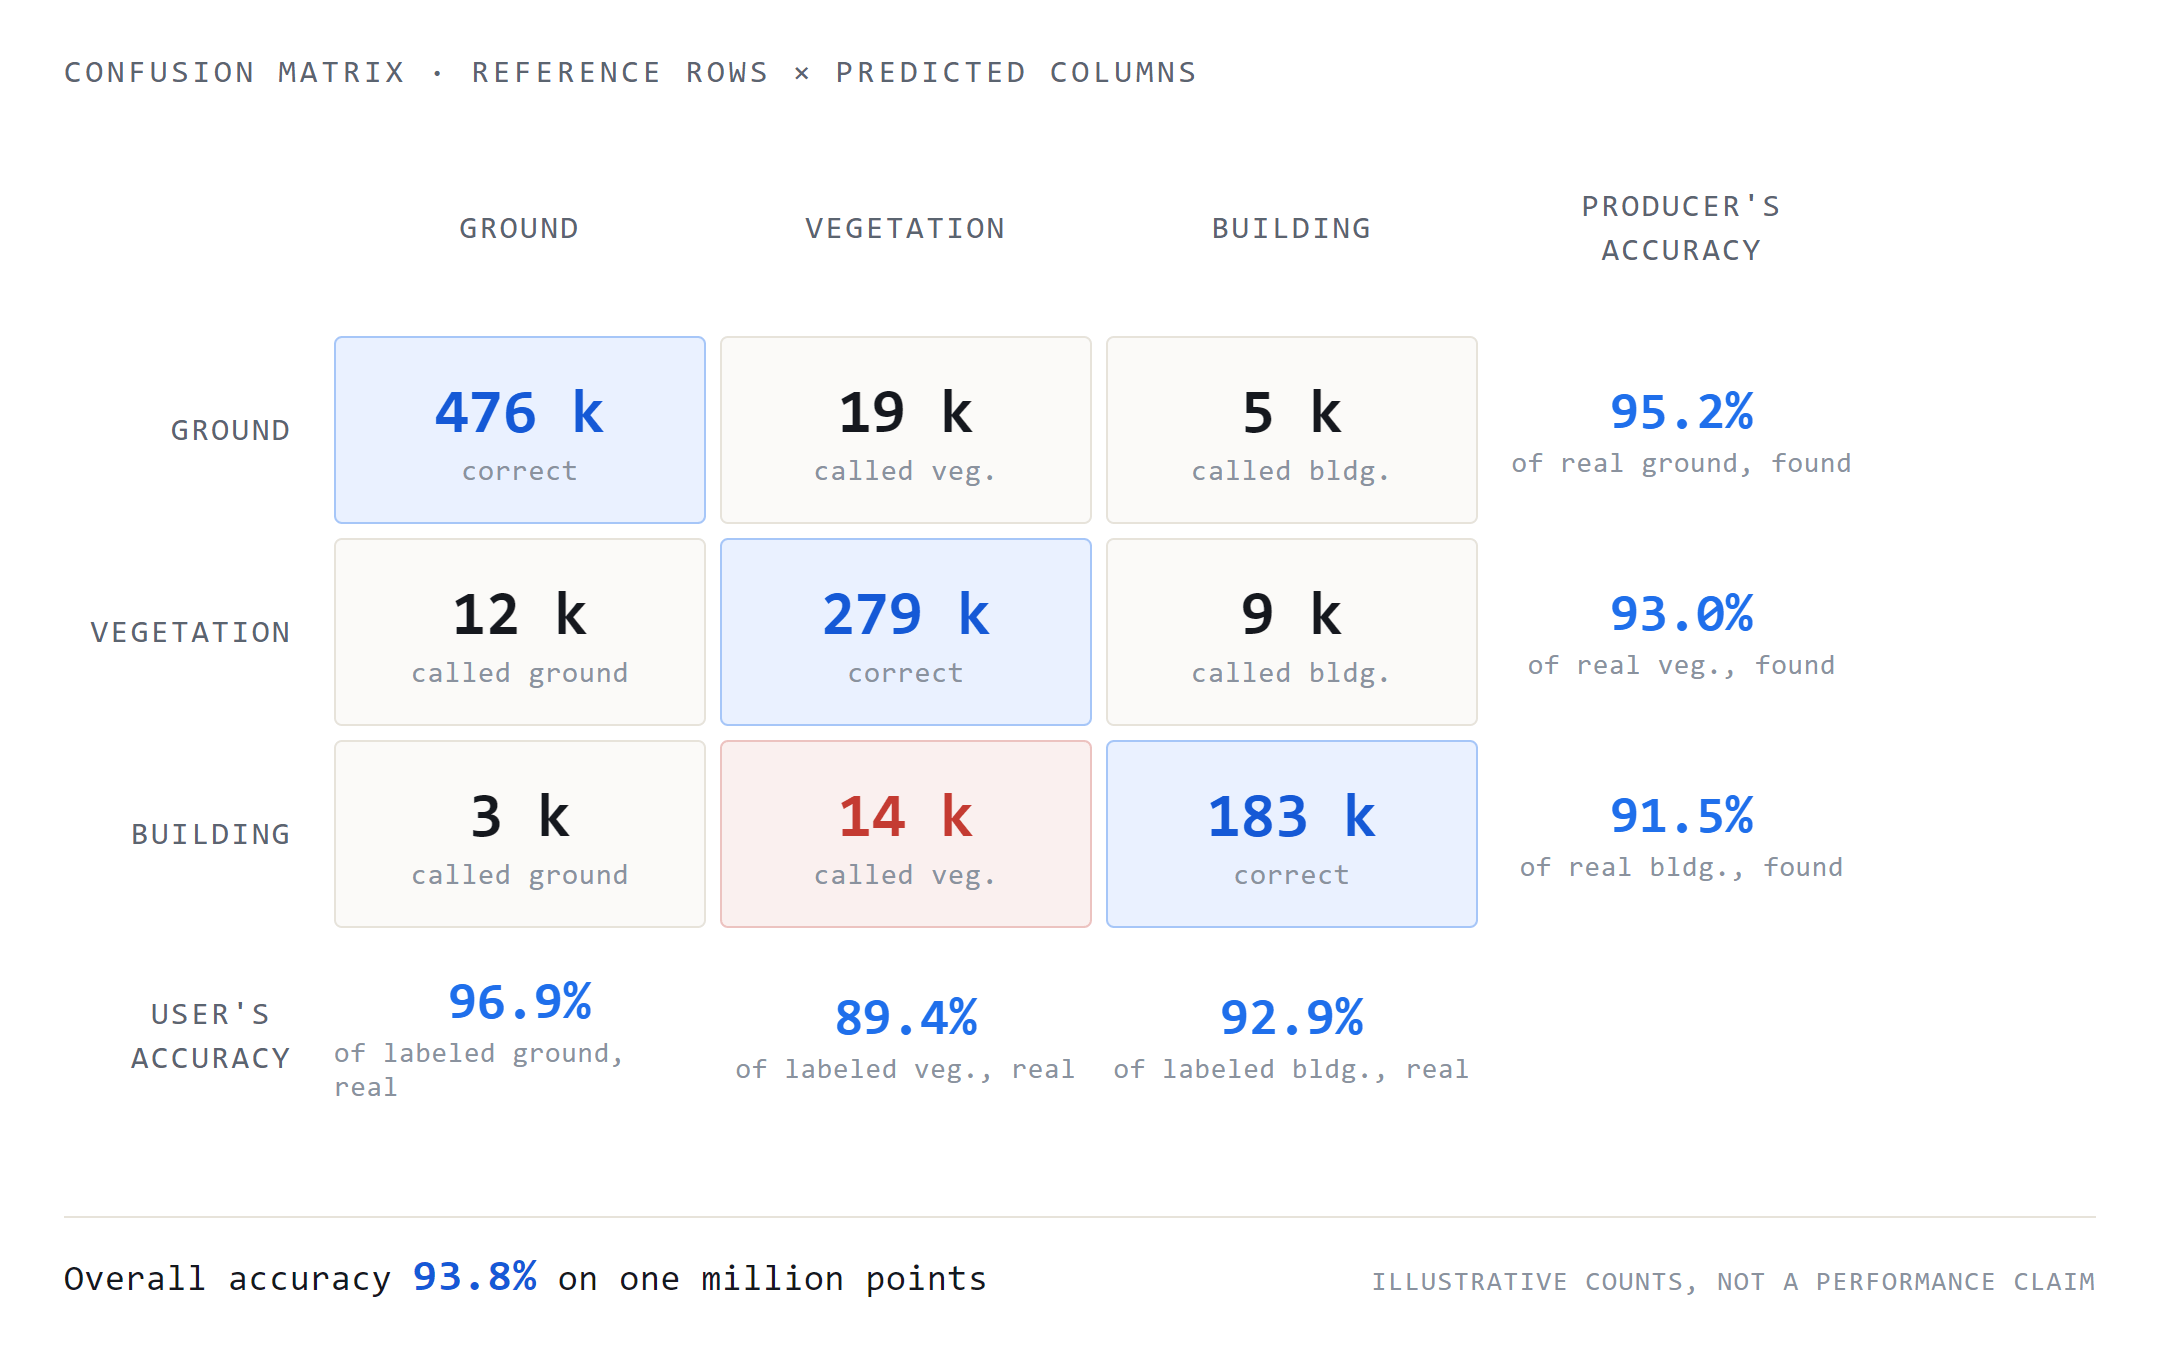
- Producer's accuracy: of everything that really was ground, how much did the model find? ML tools call this recall.
- User's accuracy: of everything the model labeled ground, how much really was ground? ML tools call this precision.
- Overall accuracy: the diagonal over the whole block. The example reads 93.8% overall while building sits at 91.5%, a gap a roofline deliverable would feel.
Reference data: the truth you measure against
An accuracy figure is only as good as its reference. Two sources do most of the work. Manually verified reference tiles are subsets a human edited to the project's class definitions, then froze as truth. Independent check points are positions surveyed separately from the LiDAR to test the geometry. Where the reference tiles sit matters as much as the metric itself. A control tile placed only on open, easy ground will flatter any model. Put reference tiles where the job is hard.
What actually degrades accuracy
A model does not fail at random. The same conditions push errors up on every job, and they tell you exactly where to put your reference tiles:
- Point density. USGS 3DEP frames it as quality levels: QL2 is roughly 2 points per square metre, QL1 roughly 8. Thin objects like poles and wires need enough returns to form a shape.
- Occlusion. Dense canopy and walls block the pulse, so ground under thick cover is built from very few returns.
- Return pattern. The last return under canopy often carries the ground. Where only one return comes back, splitting ground from low vegetation gets much harder.
- Scan angle. Points at the swath edge strike surfaces obliquely and are noisier than the centre.
- Leaf-on vs leaf-off. Leaf-off flights let more pulses reach the ground. Leaf-on canopy hides it and blurs the vegetation bands.
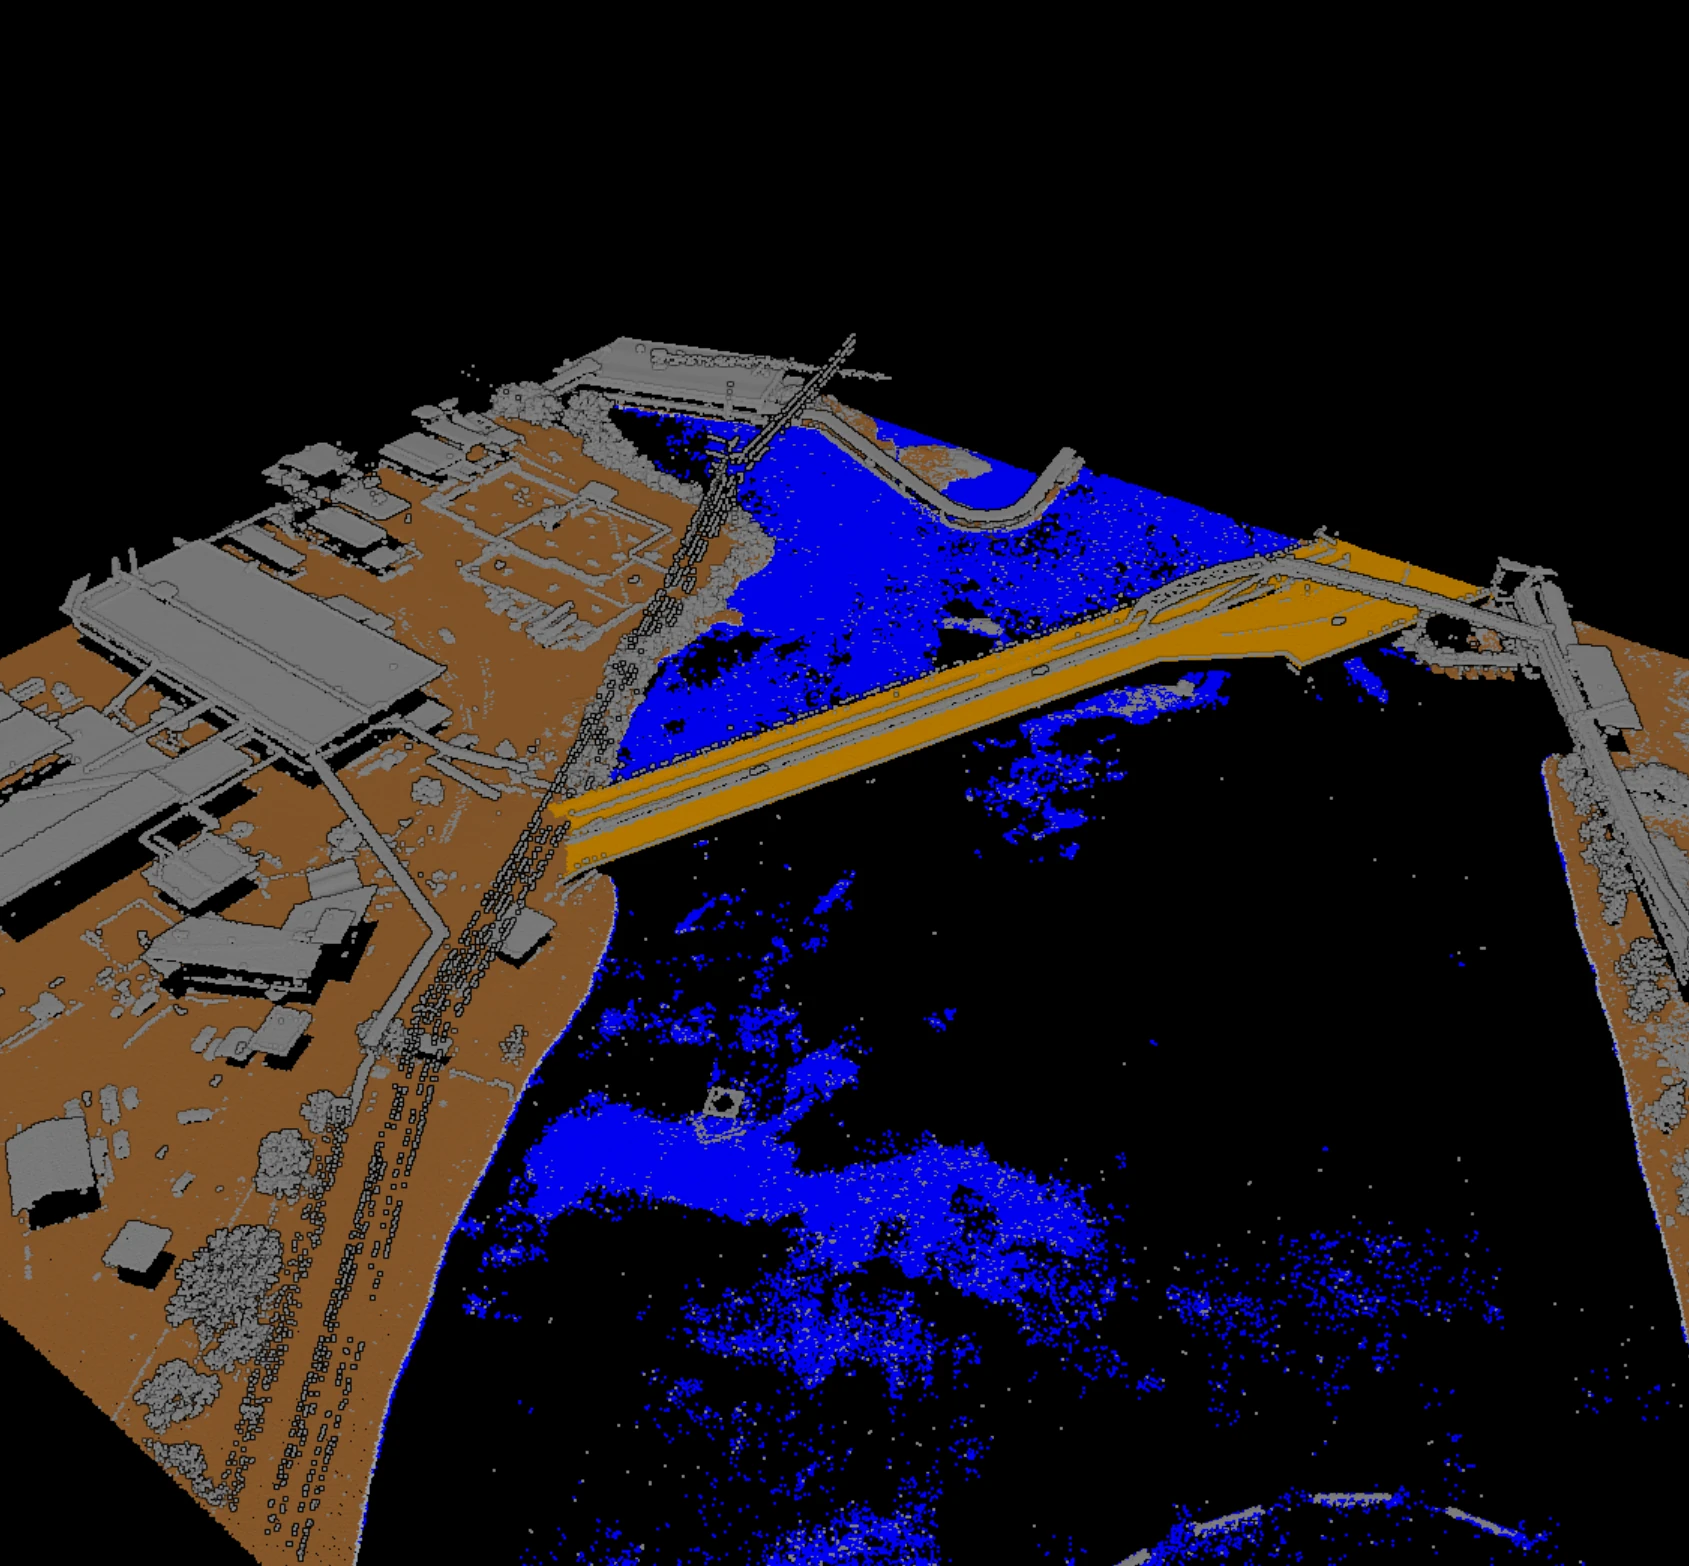
- Boundaries. Class interiors are easy. Shorelines, roof lines, and ground-to-wall transitions are where errors concentrate, so that is where accuracy should be measured.
Validating on your own data
A number produced by a vendor on the vendor's data is a starting point, not an answer. Real validation happens on your own block, with a method you could hand to an auditor:
- Sample by class, not uniformly, so rare classes like poles and wires get enough points to be measured at all.
- Re-label blind. Have a reviewer re-label a subset without seeing the model output, then compare. This catches errors a reviewer would rationalize if shown the model's answer first.
- Track errors per class and per direction with the confusion matrix, across tiles, so systematic mistakes surface instead of averaging out.
- Check reviewer agreement. Have two people label the same subset. Where humans disagree, that gap is the floor for any accuracy claim.
Then report it per deliverable, not as one global claim. Give the per-class numbers with the reference described, a class count before and after review so the client sees what moved, how much of the block was manually checked, and where the data gets harder: thin density, heavy canopy. Written that way, an accuracy claim can be inspected instead of taken on faith.
What to expect, class by class
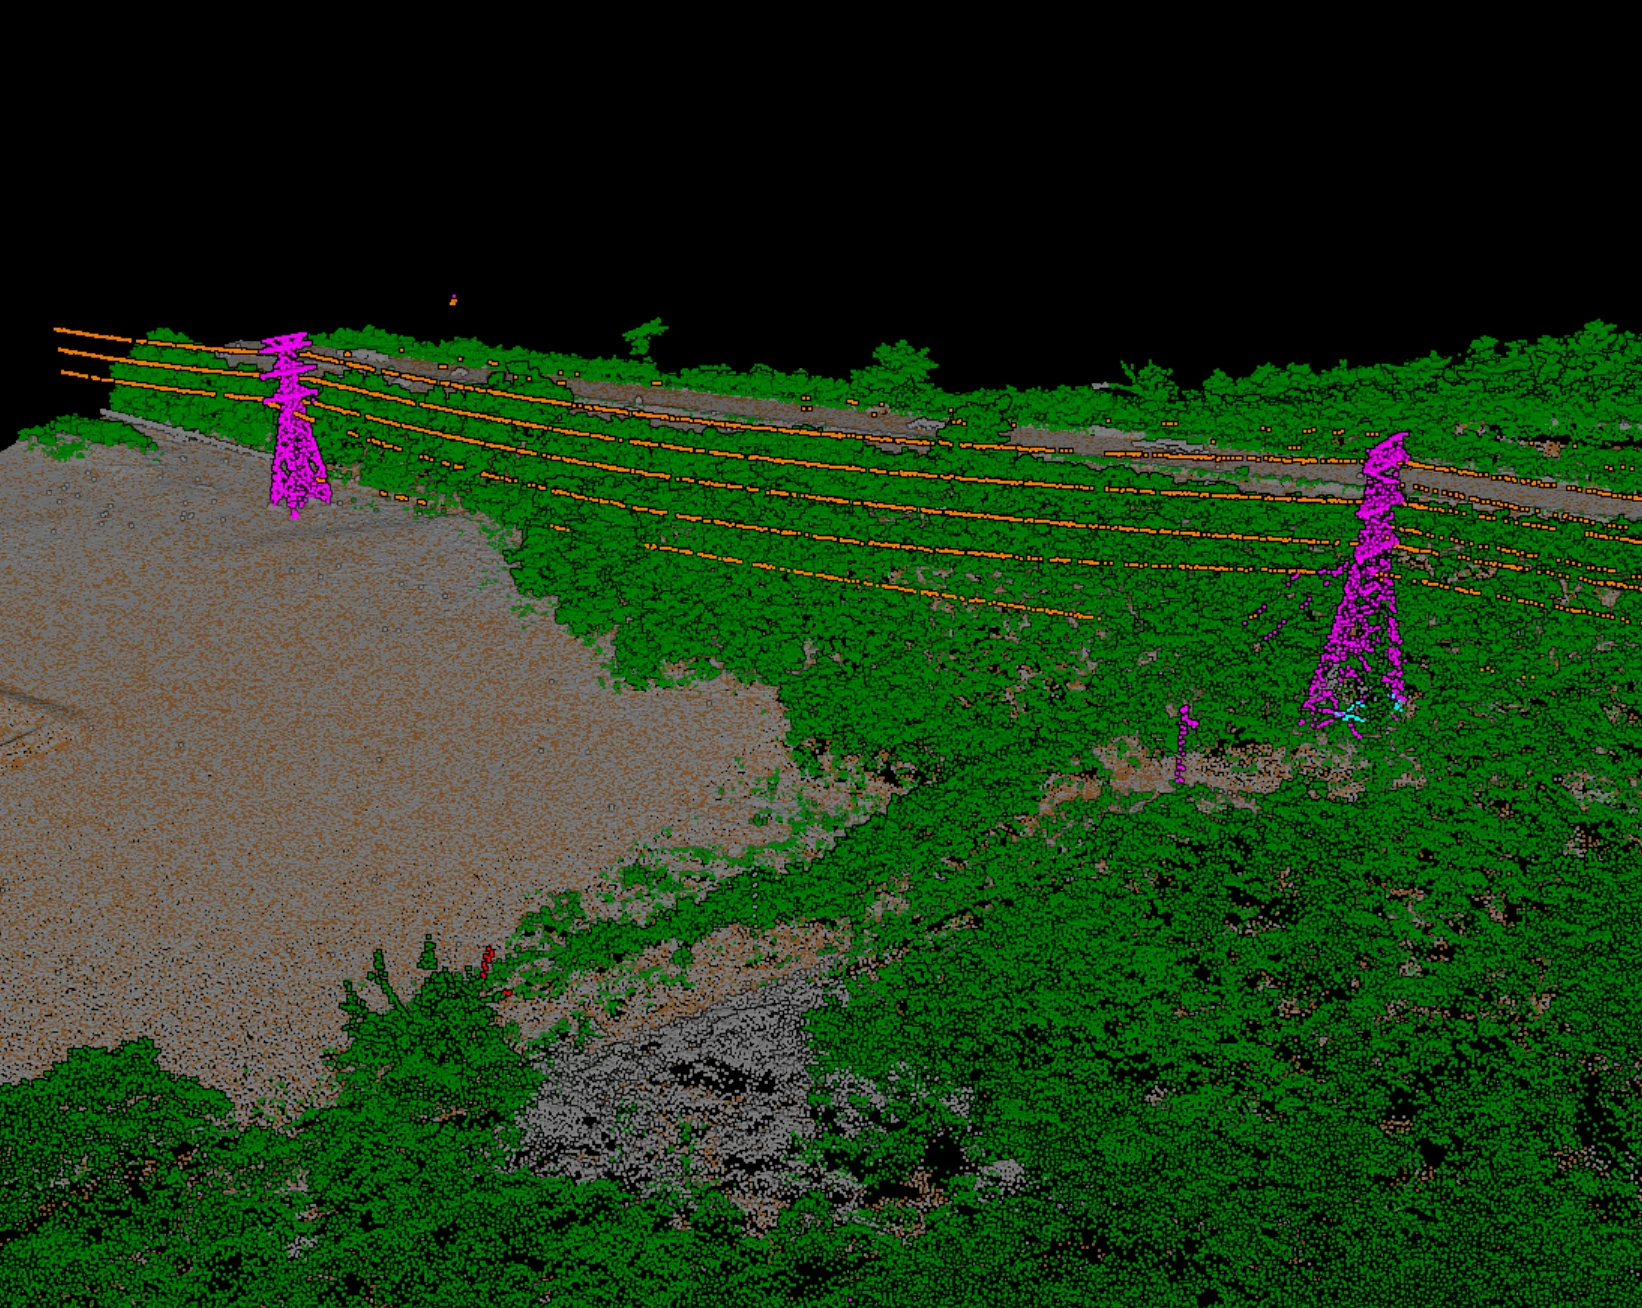
Some classes are reliably easy and others reliably hard, and saying so up front beats one blended figure. Ground on open terrain, high vegetation with strong canopy returns, and buildings with clean roof planes are the dependable ones. Poles and thin structures carry few points. Low vegetation overlaps with ground and noise. Every class boundary is harder than the class interior. These patterns hold whatever the algorithm; the method changes the effort, not which classes are inherently ambiguous.
Vecten Desktop is built for this framing. It runs locally on your own workstation, so the point cloud and the reference tiles an accuracy assessment depends on never leave your control. And because VGround, VClassify, and VUtilities are separate modules, each can be validated against its own reference tiles rather than folded into one number.
An accuracy figure is only as useful as the method behind it. Define the metric, build honest reference data, know what degrades the result, validate on your own block, report per class. Do that, and "how accurate is it?" stops being a marketing question and becomes one you can answer and defend.