Vegetation classification in LiDAR: low, medium, and high classes
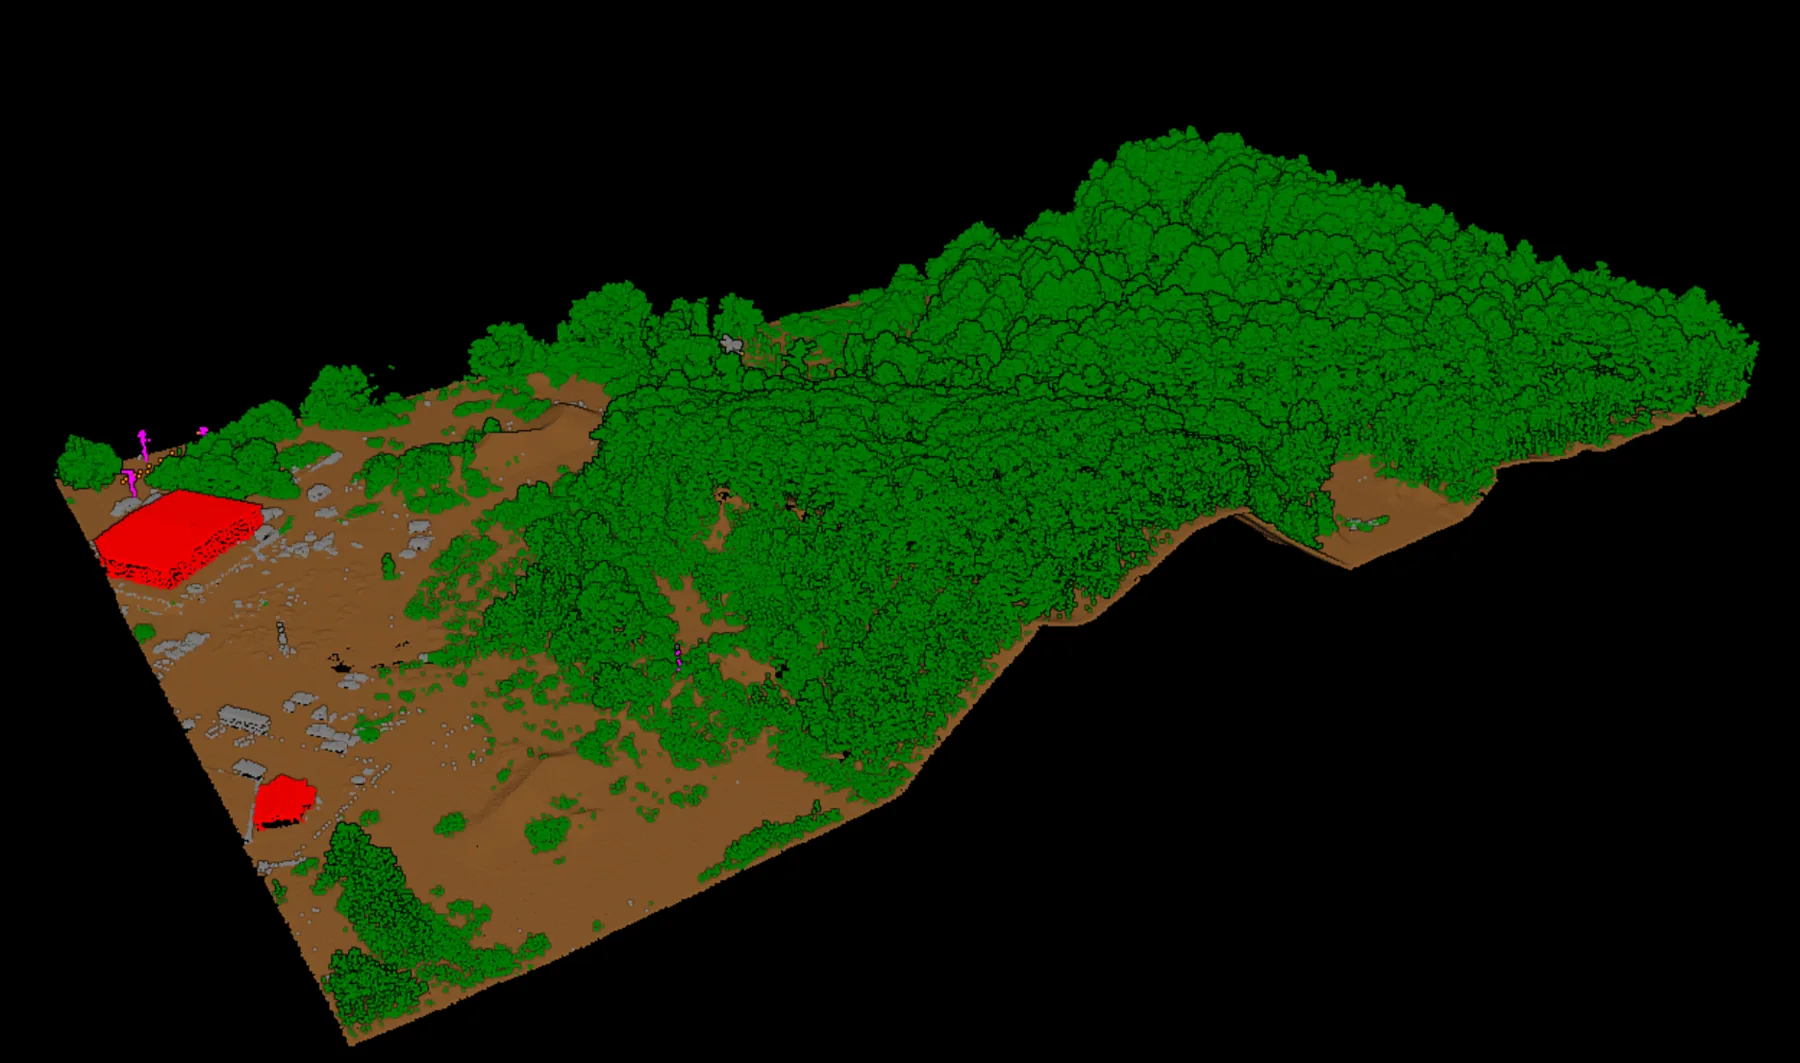
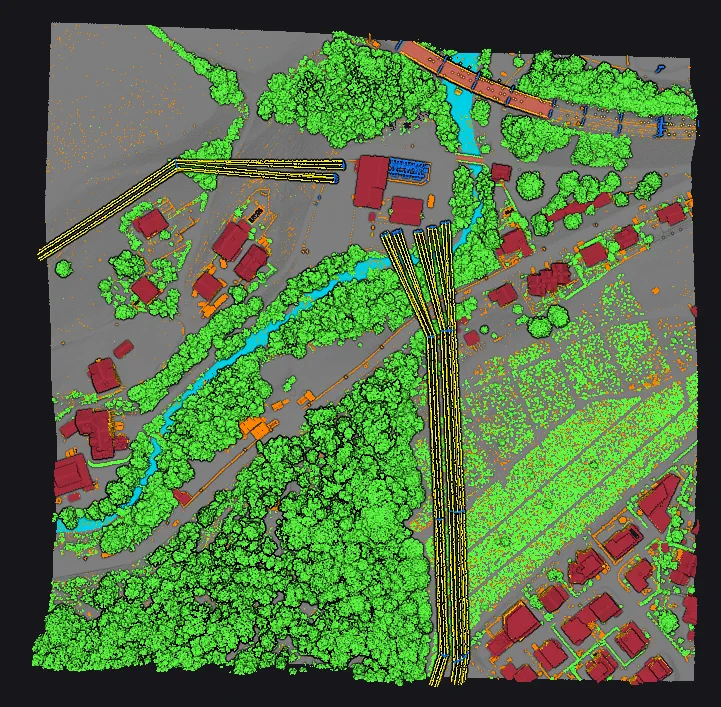
Vegetation is usually the biggest class in an airborne LiDAR block, and it is never one layer. The ASPRS scheme splits it three ways, low, medium, and high, because a forester, a terrain modeller, and a corridor engineer each need a different slice of the same canopy. Here is the surprise for newcomers: the three classes are not defined by elevation. A point at 40 metres above sea level can be low vegetation on a hilltop or high vegetation in a valley. What separates the classes is height above the ground directly beneath the point. Computing that height is the real work.
The three classes
ASPRS reserves 3 for Low Vegetation, 4 for Medium, and 5 for High. The standard fixes the codes but deliberately not the heights where one class becomes the next. Those bands are set per project, because what counts as low vegetation on a transmission corridor is not what counts on a forestry inventory. A common convention:
| Code | ASPRS class | Typical height band | Downstream product |
|---|---|---|---|
| 3 | Low Vegetation | Ground level to ~0.5 m | Bare-earth cleanup, undergrowth removal |
| 4 | Medium Vegetation | ~0.5 m to ~2 m | Shrub and brush layer, understory |
| 5 | High Vegetation | Above ~2 m | Canopy height model, forest metrics, encroachment |
Normalized height: everything is measured from the ground up
To place a point in a band, subtract the ground elevation beneath it from its own elevation. That is normalized height. Flatten the landscape this way and a 3-metre shrub reads as 3 metres whether it stands in a valley or on a ridge. Which means vegetation classification leans entirely on the ground class: if ground returns are missing under dense canopy, the interpolated terrain floats upward and every tree above it measures short. The ground pass is run and reviewed before vegetation is split, not after.
Why a tree is full of points
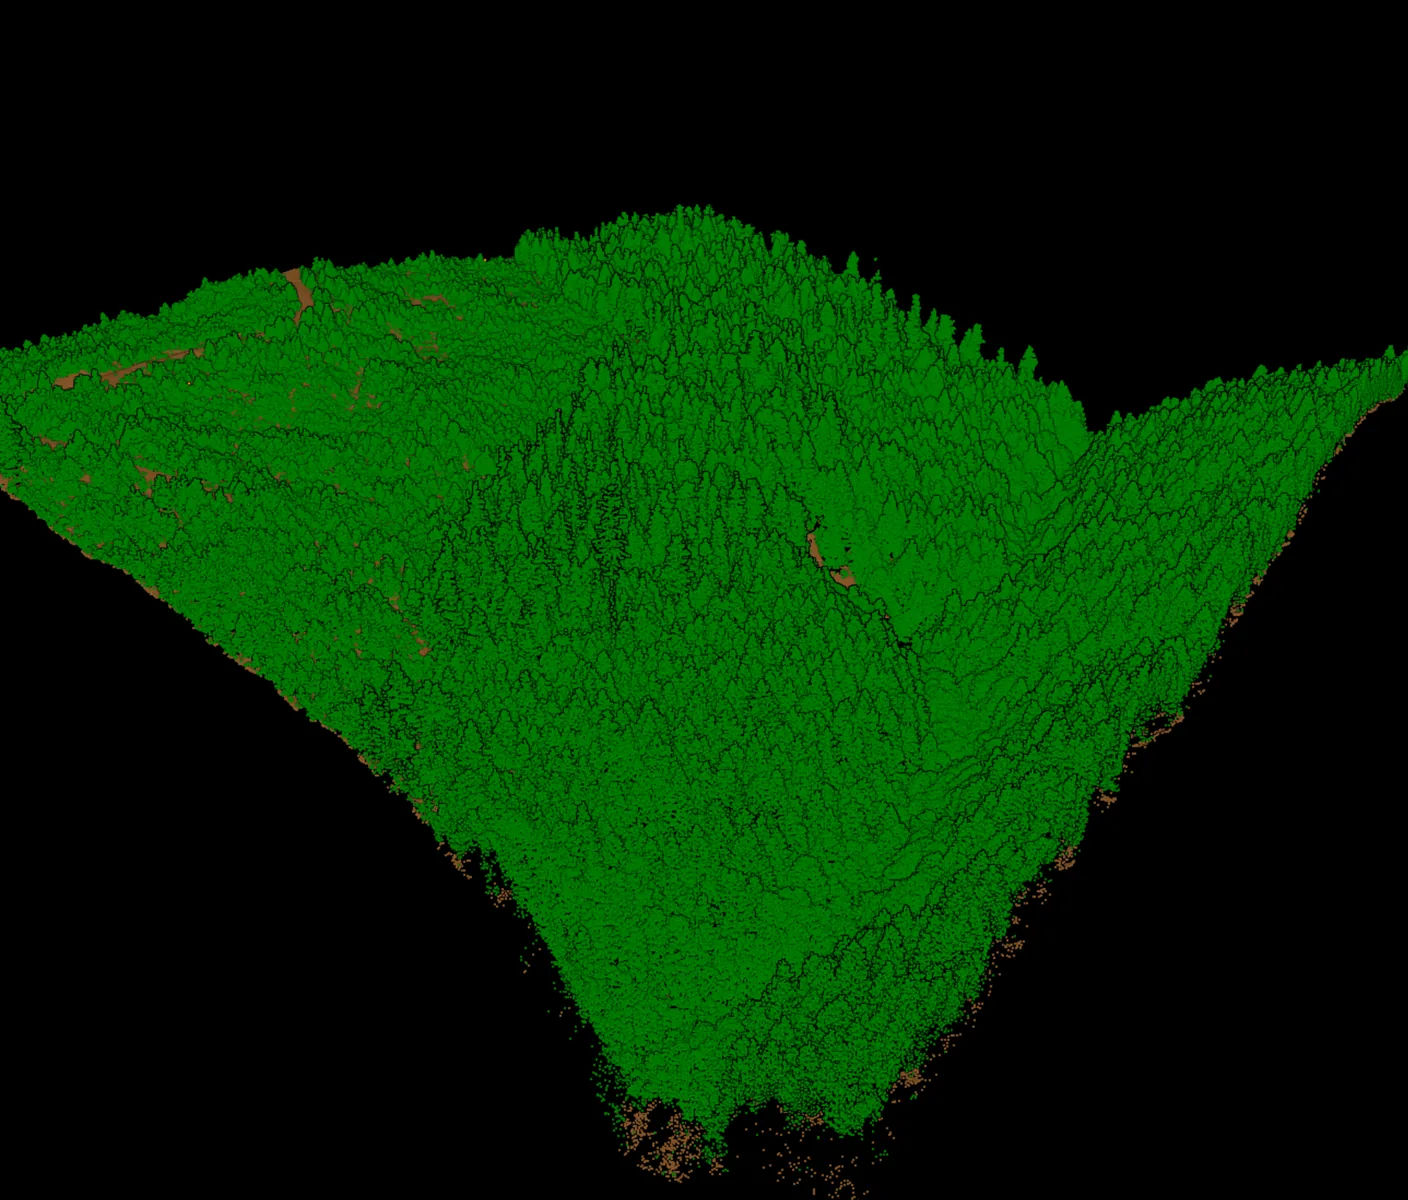
A LiDAR pulse is not a pencil-thin ray that stops at the first thing it touches. It is a beam with real width, and a canopy is full of gaps. Clip the edge of a leaf and part of the pulse bounces back as the first return; the rest carries on, catches a branch as an intermediate return, and whatever reaches the forest floor comes back last. One pulse over a tree routinely gives two or three returns stacked above each other. That is why vegetation is rich with points, and why the return attributes carried on every point (return number, number of returns) are strong signals for the vegetation classes: intermediate returns exist over trees and rarely over hard surfaces.
The same physics sets the limits. Over leaf-off deciduous stands, most pulses punch through and the last returns paint a solid terrain surface. Over dense evergreen canopy, few pulses reach the floor, the ground is starved of points, and the normalized-height problem above comes straight back.
The confusion zones
Most vegetation points are easy. The manual editing happens in three boundary zones:
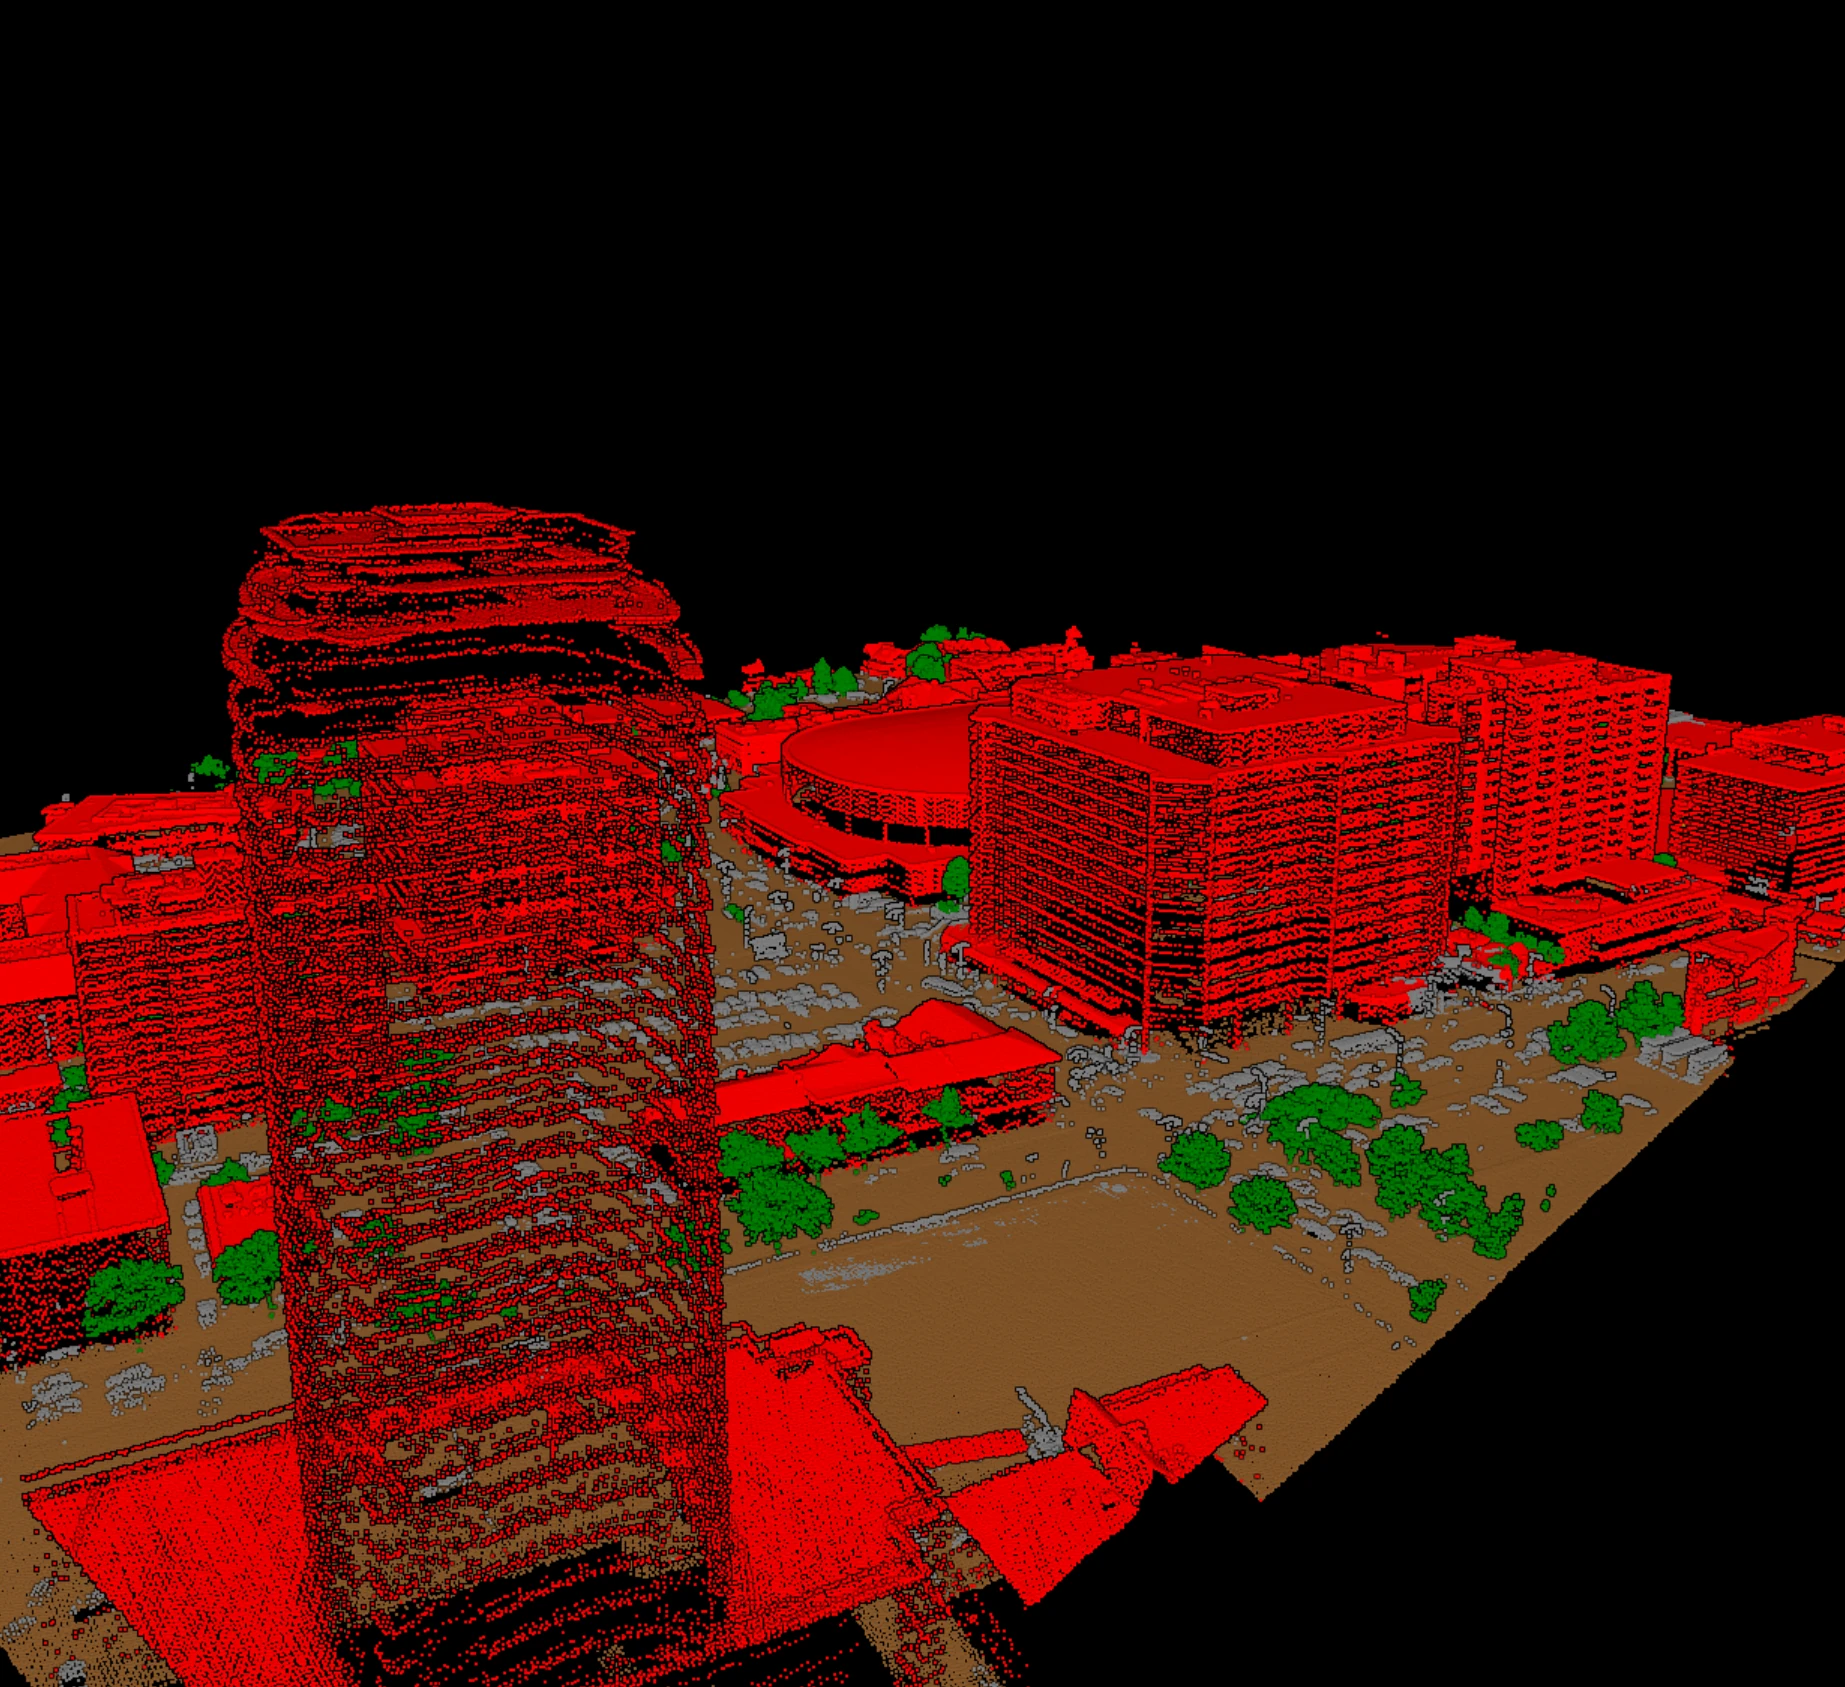
- Vegetation vs buildings. Both rise well above ground. Roofs hold flat planes and give clean single returns; canopy is irregular and scatters the pulse. Branches overhanging a roof are the stubborn case.
- Vegetation vs noise. Birds and dust above the canopy get pulled into high vegetation; low outliers below the ground get pulled into low vegetation.
- Low vegetation vs ground vs noise. The band within a few decimetres of the ground, where all three overlap in height. A tuft of grass, a stone, and the true bare earth sit in the same vertical slice. This is the least stable vegetation class and the one reviewers spend the most time on.
From classes to products: the canopy height model
The payoff of a clean split is the products it unlocks. The headline one is the canopy height model: CHM = DSM − DTM. The surface model records the top of the canopy from first returns, the terrain model records the bare earth, and their difference is the height of everything standing on the ground. Over a forest, that map is tree height across the whole block.
- Forestry inventory: canopy cover, height percentiles, and stand metrics from the high-vegetation returns.
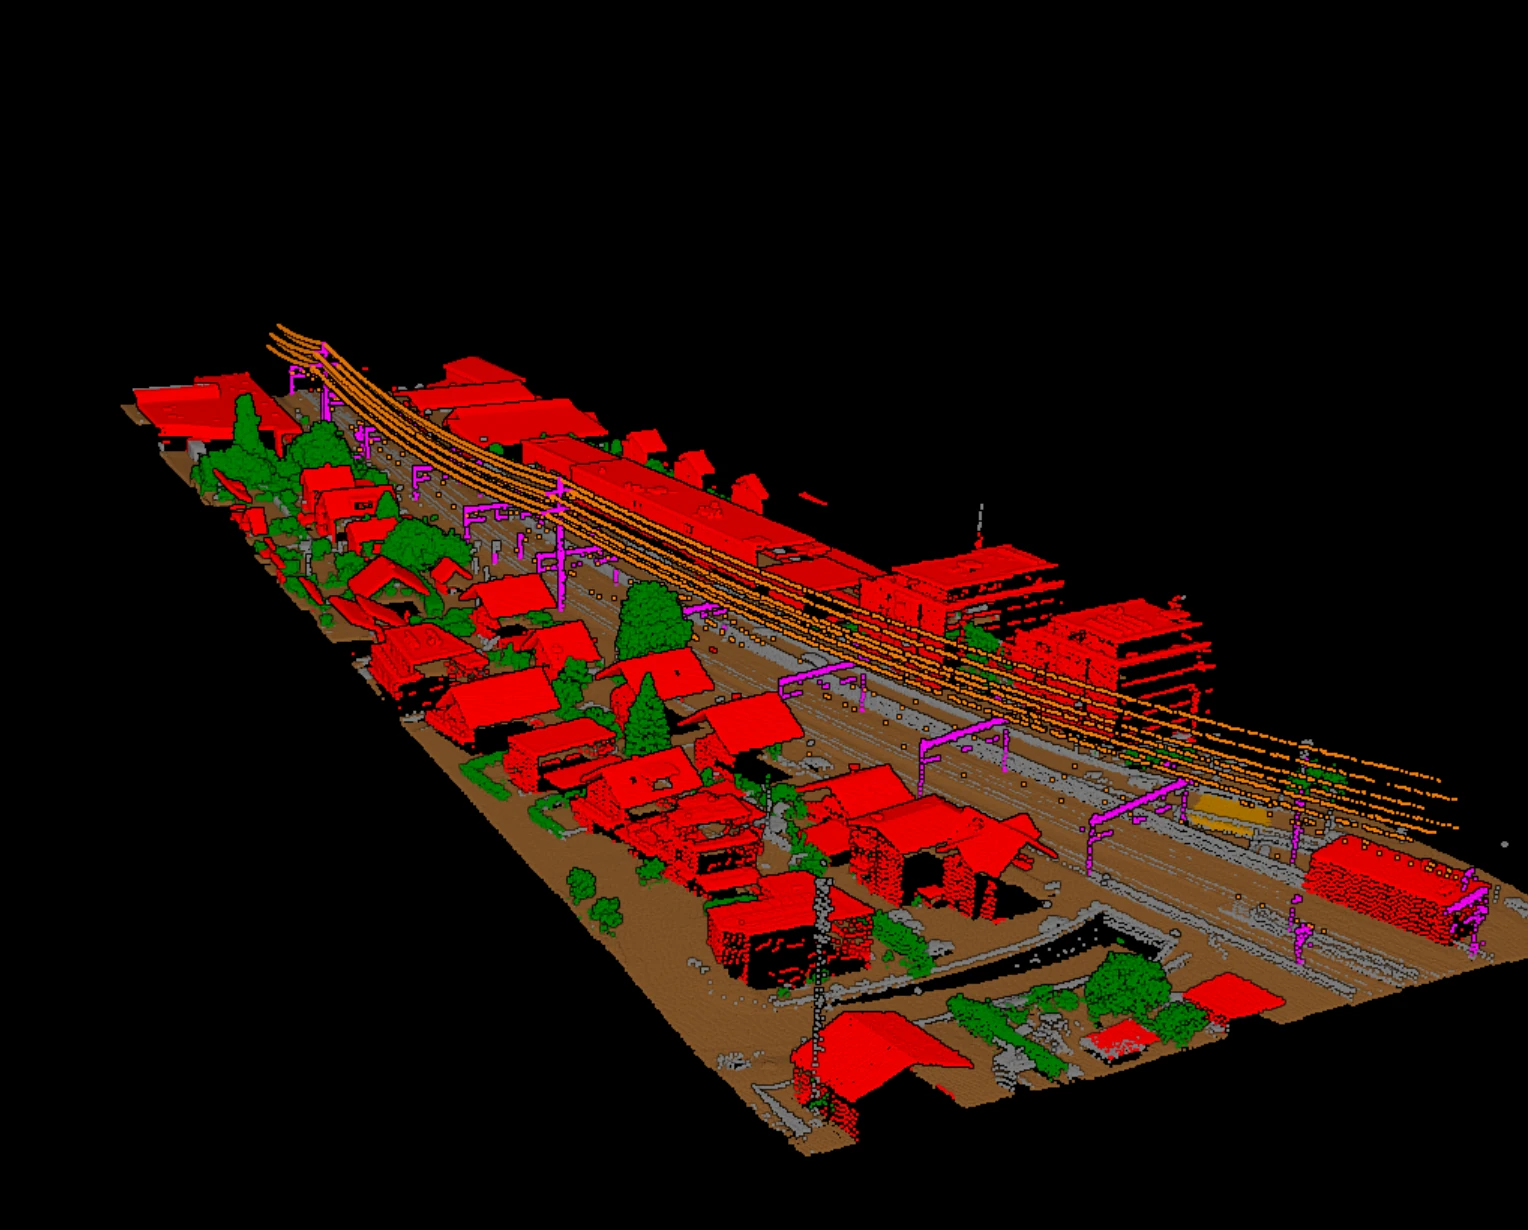
- Encroachment and clearance layers: on utility corridors, high vegetation within a set distance of the conductors flags where trimming is due.
- Fuel layers: for wildfire modelling, the vertical distribution between the low and high classes.
- Bare-earth cleanup: removing low and medium vegetation leaves a clean surface for contours and hydrology.
Quality control
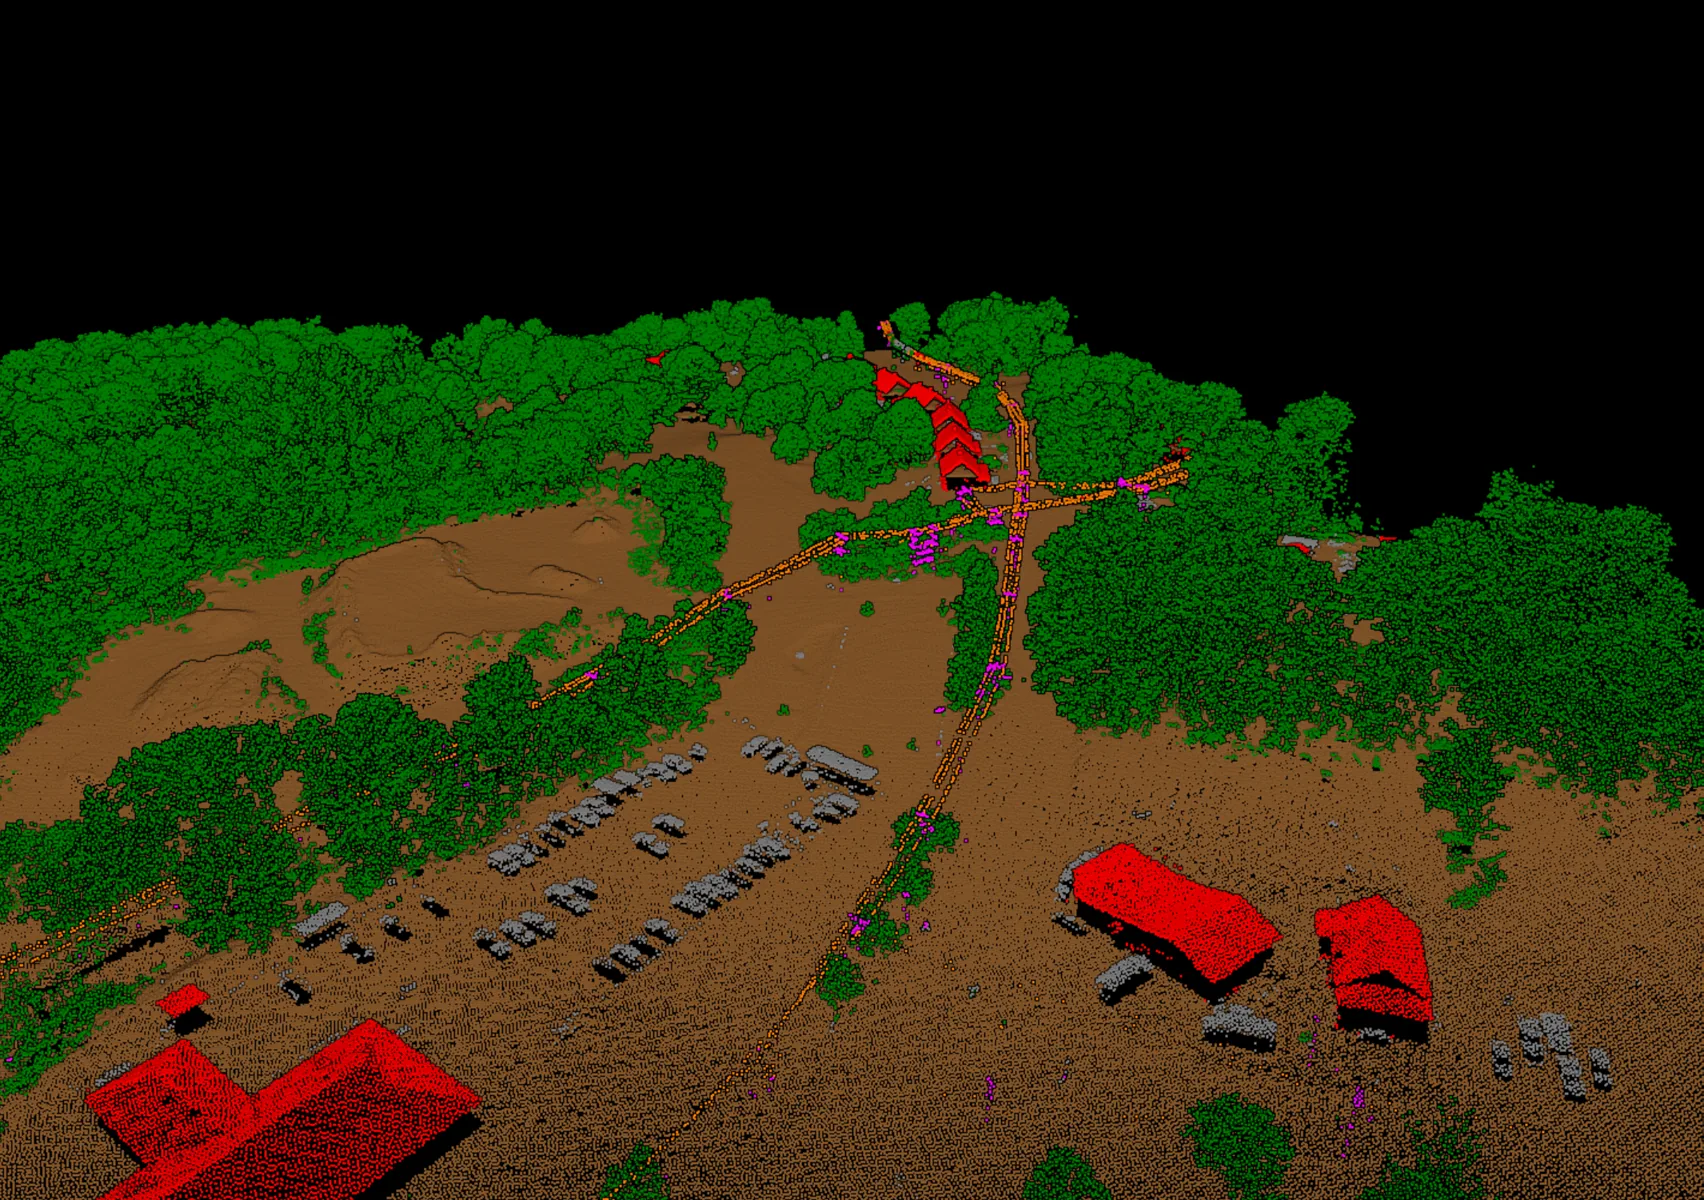
Season and point density decide how complete the classes can be, and both were fixed before the first point was classified: a leaf-off flight feeds the terrain and thins the canopy, a leaf-on flight does the opposite, and a dense survey resolves shrubs a sparse one cannot. Within those limits, QC on vegetation is mostly visual:
- Cross-sections: slice the canopy and read the classes top to bottom, high over medium over low over ground, with nothing floating below the terrain.
- CHM inspection: negative heights mean ground was called vegetation; flat holes mean canopy was called ground.
- Class counts: a tile with almost no low vegetation next to tiles full of it signals a threshold that drifted.
- Edges and overhangs: roof edges and corridor margins, where vegetation meets buildings and structures.
In Vecten Desktop, vegetation belongs to VClassify, the module for the core semantic classes; VGround covers the terrain surface the height bands are measured against, and on corridor jobs VUtilities adds the conductor and structure classes that encroachment products lean on. Everything runs locally, so the point clouds, often the most sensitive asset on a project, stay on the operator's own machine.